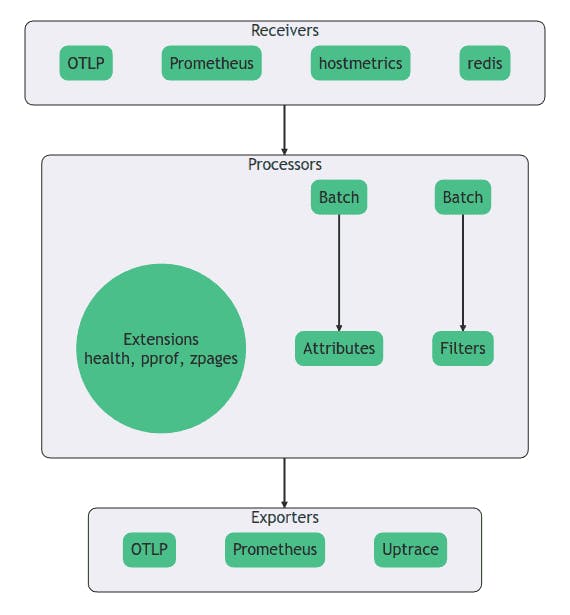
OpenTeleletry Collector is an open source data collection pipeline that allows you to monitor CPU, RAM, disk, network metrics, and many more.
Collector itself does not include built-in storage or analysis capabilities, but you can export the data to Uptrace and ClickHouse, using them as a replacement for Grafana and Prometheus.
When compared to Prometheus, ClickHouse can offer small on-disk data size and better query performance when analyzing millions of timeseries.
What is OpenTelemetry?
OpenTelemetry is an open-source observability framework hosted by Cloud Native Computing Foundation. It is a merger of OpenCensus and OpenTracing projects.
OpenTelemetry provides a standardized way to capture and transmit metrics, traces, and logs from various software components in a distributed system.
OpenTelemetry is designed to be vendor-agnostic and supports multiple programming languages, making it suitable for a wide range of applications and environments.
OpenTelemetry Collector
OpenTelemetry Collector acts as a middleware between instrumented applications and various backends or observability platforms.
OpenTelemetry Collector can also act as an agent that pulls telemetry data from systems you want to monitor and sends it to tracing tools using the OpenTelemetry protocol.
For example, Collector can monitor Redis by periodically running the INFO command to collect telemetry data and send it to your observability pipeline for analysis and monitoring.

Host metrics
hostmetricsreceiver is an OpenTelemetry Collector plugin that gathers various metrics about the host system, for example, CPU, RAM, disk metrics and other system-level metrics.
However, OpenTelemetry itself does not include built-in storage or analysis capabilities for the collected data. Instead, you can export the data to an OpenTelemetry backend of your choice such as Prometheus or Uptrace.
To start collecting host metrics, you need to install Otel Collector on each system you want to monitor and add the following lines to the Collector config:
receivers:
  hostmetrics:
    collection_interval: 10s
    scrapers:
      # CPU utilization metrics
      cpu:
      # Disk I/O metrics
      disk:
      # File System utilization metrics
      filesystem:
      # CPU load metrics
      load:
      # Memory utilization metrics
      memory:
      # Network interface I/O metrics & TCP connection metrics
      network:
      # Paging/Swap space utilization and I/O metrics
      paging:
See OpenTelemetry Collector host metrics documentation for details.
What is Uptrace?
Uptrace is an open source APM tool that supports distributed tracing, metrics, and logs. You can use it to monitor applications and set up automatic alerts to receive notifications via email, Slack, Telegram, and more.
Uptrace uses OpenTelelemetry to collect data and ClickHouse database to store it. Uptrace also requires PostgreSQL database to store metadata such as metric names and alerts.
You can install Uptrace binary or use the Docker example to run the backend with a single command.
After starting Uptrace, you will receive a data source name (DSN) that contains connection details for Uptrace.
You can then export the data from Collector to Uptrace using the OTLP exporter and passing the DSN in headers:
exporters:
  otlp/uptrace:
    endpoint: localhost:14317
    tls: { insecure: true }
    headers: { 'uptrace-dsn': 'http://project1_secret_token@localhost:14317/1' }
Dashboards
Uptrace maintains dashboards templates for monitoring system metrics, Redis, PostgreSQL, MySQL, Kafka, JVM, and many more. When the relevant metrics start arriving to Uptrace, it automatically creates dashboards from templates saving your time.
Uptrace supports 2 types of dashboards:
A grid-based dashboard looks like a classical grid of charts.
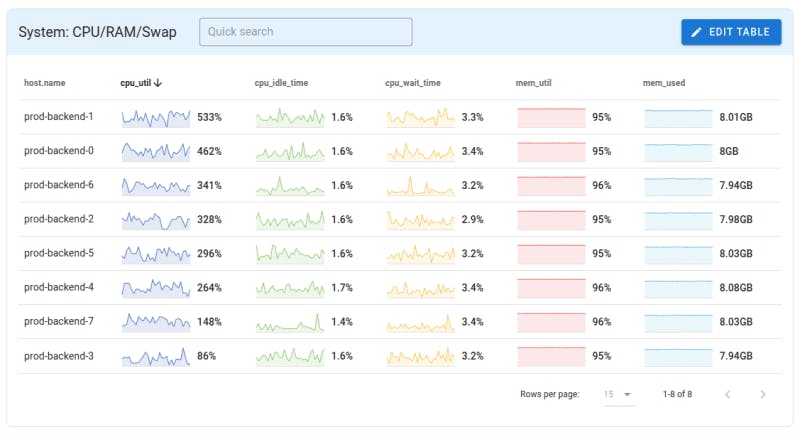
A table-based dashboard is a table of items where each item leads to a separate grid-based dashboard for the item, for example, a table of hostnames with some metrics for each hostname.
In other words, table-based dashboards allow to parameterize grid-based dashboards with attributes from the table. For example, Uptrace uses a table-based dashboard to monitor number of sampled and dropped spans for each project:
metrics:
  - uptrace.projects.spans as $spans
query:
  - $spans{type='spans'} as sampled_spans
  - $spans{type='dropped'} as dropped_spans
  - group by project_id
| project_id | sampled_spans | dropped_spans | Link to a grid-based dashboard |
| 1 | 100 | 0 | Dash with where project_id = 1 |
| 2 | 110 | 0 | Dash with where project_id = 2 |
| ... | ... | ... | ... |
| 999 | 90 | 0 | Dash with where project_id = 999 |

Monitoring
You can also use Uptrace to create alerts and receive notifications when metric values meet certain conditions, for example, you can create an alert when system.filesystem.usage metric exceeds 90%.
monitors:
  - name: Filesystem usage
    metrics:
      - system.filesystem.usage as $fs_usage
    query:
      - $fs_usage{state='used'} / $fs_usage as fs_util
      - group by host.name, mountpoint
      - where mountpoint !~ "/snap"
    columns:
      fs_util: { unit: utilization }
    max_value: 0.9
    for_duration: 3
To monitor CPU usage, you can use the system.cpu.load_average.15m metrics and number of cores from the system.cpu.time metric:
monitors:
  - name: CPU usage
    metrics:
      - system.cpu.load_average.15m as $load_avg_15m
      - system.cpu.time as $cpu_time
    query:
      - $load_avg_15m / uniq($cpu_time.cpu) as cpu_util
      - group by host.name
    columns:
      cpu_util: { unit: utilization }
    max_value: 3
    for_duration: 10
Conclusion
Uptrace complements the data collection capabilities of OpenTelemetry by providing the necessary infrastructure and functionality for storing, analyzing, and extracting insights from the collected telemetry data.
Besides metrics, Uptrace also supports 2 other major observability signals such as traces and logs, allowing you have all data on a single pane.
